Do you look at the ROI of email marketing of other companies and wonder why your email marketing metrics aren’t showing something as impressive?
Writing great subject lines, maintaining list hygiene, segmenting your lists, crafting the right email contents, timing the email right…
All this, and more, goes into a successful campaign.
However, there’s one more thing.
Once you’ve hit Send, your subscribers will begin responding. Some of them will open your email and head towards the CTA. Others will scroll through and not take action. A few might even ignore your email.
You want to know what’s happening.
You must be able to see for yourself how the campaign performed.
Getting result consistently is possible only if you can view your results in the first place.
Infographic on email marketing metrics
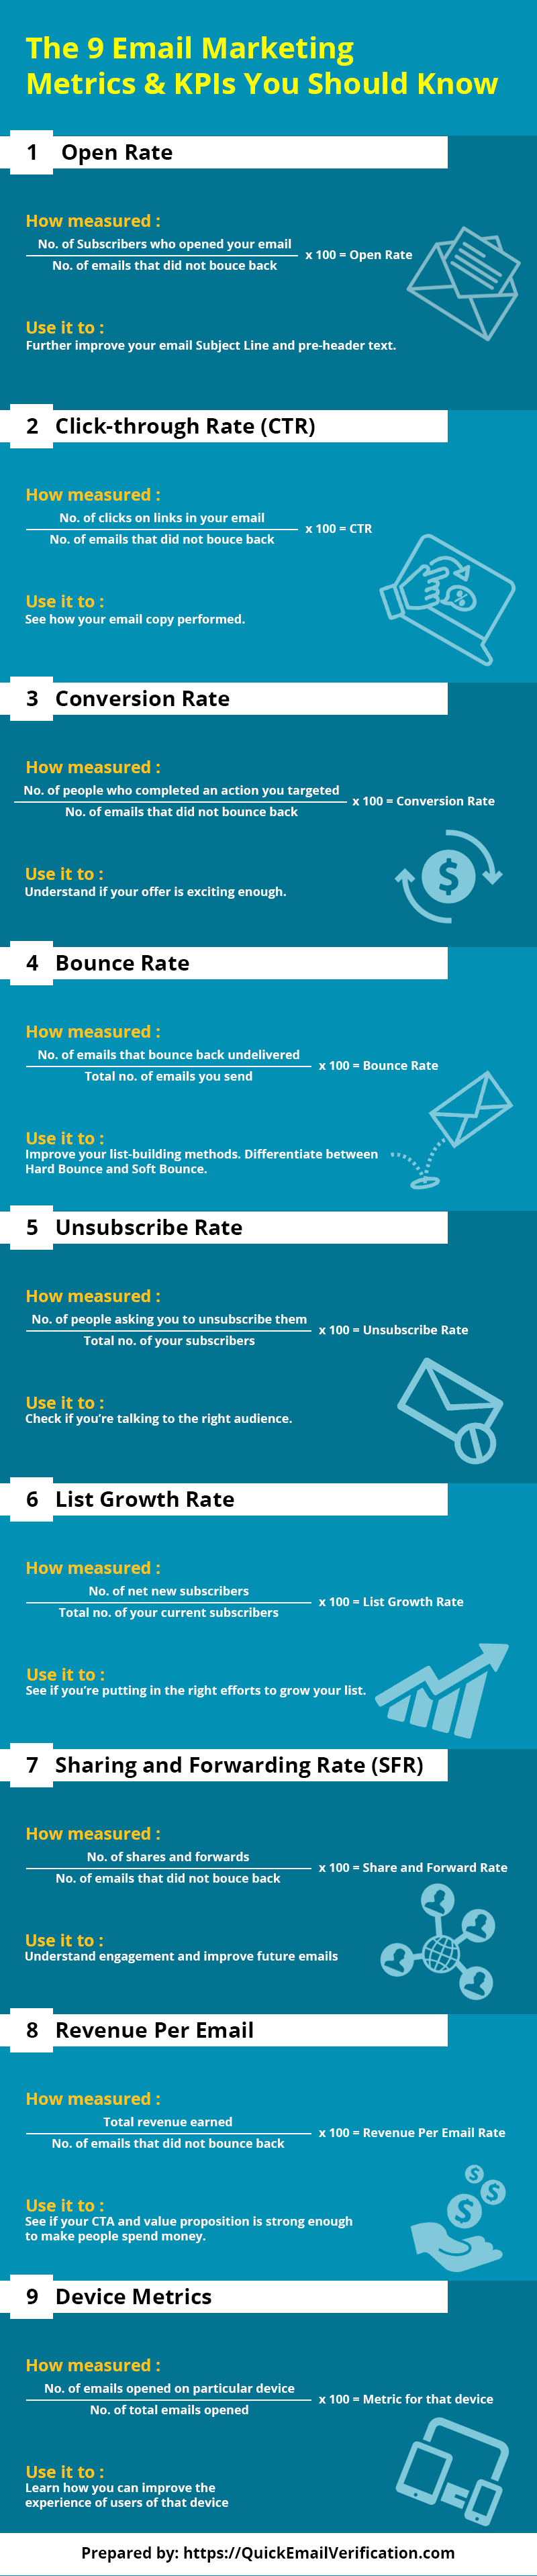
Now we’ll discuss these 9 top email marketing metrics you should know in detail:
1. Open Rate
What is Open Rate in: Open Rate tells you how many of your emails were actually opened. Because the subscriber can’t take any action you want without first opening your email, Open Rate can be called the most basic metric.
How is Open Rate measured: Open Rate is the number of your subscribers who opened the email, expressed as a percentage of the number of non-bounced emails you sent.
Example: Let’s say you sent out 1,000 emails that did not bounce. If 690 subscribers opened those emails, your Open Rate will be (690 / 1000) * 100 = 69%.
How to use Open Rate: Use Open Rate to see how you can further improve your email Subject Line and pre-header text, the two things a subscriber uses to decide if they would like to open an email. Treat it as you would treat A/B test results.
Apart from that, you can learn what days and times provide with optimum Open Rate.
Also understand if you’re seeing a substantial difference in the Open Rate on larger screens vs Open Rate on handheld devices.
Things to keep in mind: To learn whether an email is opened, an invisible 1×1 image is loaded into the email. When the email is opened, this image is downloaded. Open Rate is based on these downloads.
Due to a number of reasons, this measurement can’t be 100% accurate, so treat your Open Rate with a degree of healthy skepticism.
Finally, opening an email is the subscriber’s entry into your offer. If you’re seeing a good Open Rate but your sales refuse to change, you likely need to fix something in the sales copy, not your email subject line.
2. Click-through Rate (CTR)
What is Click-through Rate: Click-through Rate, popularly known by the abbreviation CTR, shows how many clicks happened on the links you put inside your email.
How many people click the links inside your email?
How is CTR measured: CTR is the number of clicks expressed as a percentage of the total emails that didn’t bounce back.
Example: If you sent out 1,000 emails that did not bounce and there were a total of 80 clicks, your Click-through Rate is (80 / 1,000) * 100 = 8%.
How to use CTR: If Open Rate tells how the email Subject Line performed, your CTR tells you how your email copy performed and whether the recipient actually found value in whatever you had to offer.
At a finer level, CTR is better evidence of engagement than Open Rate, because CTR tells you how many people actually took the next step. In that sense, this is your correct audience and not the one you in your Open Rate.
Segmenting your mailing list is known to improve your CTR.
Things to keep in mind: Actually, there are two ways of calculating CTR.
You either use the number of total delivered emails as your base or use the total number of emails opened as your base against which to compare the number of clicks.
Simultaneously, there could be multiple clicks too from the same recipient. Finally, you must keep in sight if your email contained more than one links.
Since there are more than ways of looking at CTR, make sure you freeze on one method and stick to it throughout to ensure consistency.
3. Conversion Rate
What is Conversion Rate: Conversion Rate tells you what proportion of people took that final action you wanted them to ultimately take. The action could be anything from subscribing for a newsletter, opting for a free trial, signing up for a webinar, making a purchase and so on.
Either of the two actions could lead to conversion.
How is Conversion Rate measured: Conversion Rate is the percentage of people who complete a desired action, calculated against the total number of emails delivered.
Example: If you delivered 1,000 emails and 19 people completed a certain action, your Conversion Rate is (19 / 1,000) * 100 = 1.9%.
How to use Conversion Rate: Conversion Rate should be analysed in the light of the previous two KPIs, i.e. Open Rate and CTR.
If, for instance, you have a healthy Conversion Rate but your Open Rate or CTR is lousy, there’s likely more work to be done on those two metrics than on Conversion Rate.
Conversion Rate gives you a very close picture of how exciting your offer looks like to the recipient.
Things to keep in mind: The results you’ll see will change with what you’ve defined as desired action. Getting people to sign will be easier than asking them to spend money.
Your communications through additional channels (social media, for instance) also influence your customers.
Finally, make sure to include unique tracking URLs in every link in your email. That will help you easily know from where the action originated.
4. Bounce Rate
What is Bounce Rate: Bounce Rate tells you how many email that you sent out bounced back to you undelivered.
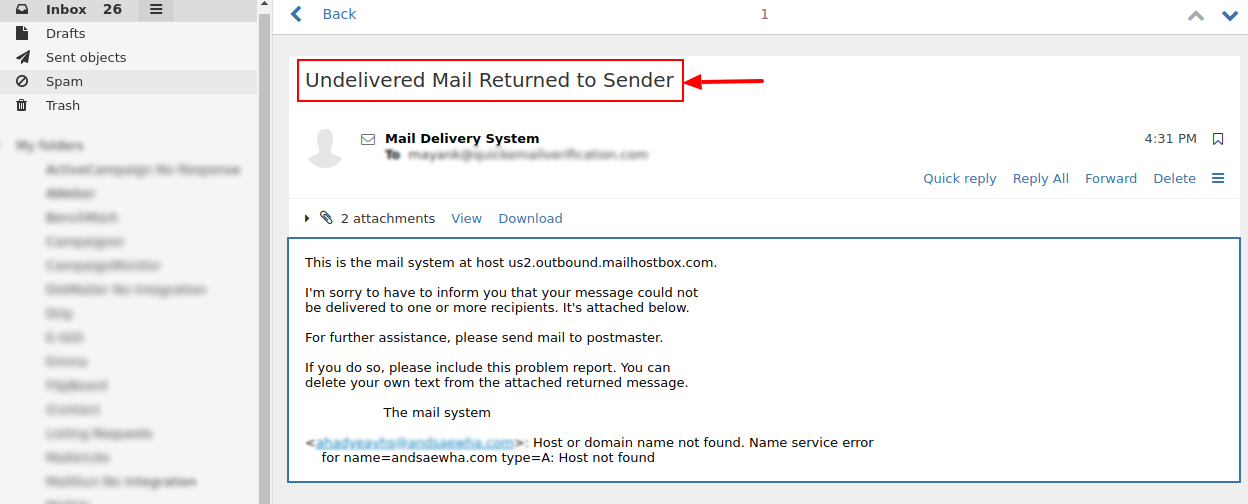
Email list cleaning will prevent issues like hard bounce.
How is Bounce Rate measured: Bounce Rate is typically measured as the number of emails that bounce back as a percentage of the total number of emails you sent out.
Example: If you sent out 1,000 emails of which 32 emails bounce back, your Bounce Rate is (32 / 1,000) * 100 = 3.2%
A few words about Bounce Rate: You need to know that there are two kinds of bounces: Hard Bounce and Soft Bounce. Hard Bounce happens when the email address is invalid and your email will never be delivered, no matter what you do.
Soft Bounce, on the other hand, is temporary. Your email couldn’t be delivered because of reasons like the recipient server was down, or their inbox was full or something similar. You can try re-sending after some time.
Ideally, you should be able to successfully re-send the Soft Bounces after a few attempts.
How to use Bounce Rate: Your bounce rate should be further classified on the basis of your sources. Subscribers from webinars, subscribers from a freebie, subscribers from a PDF…
Now you can sit down and see which source is giving you the most bounces and begin working on it. Either you need to improve your CTA with the source or you might want to create a separate list which consistently displays poor engagement.
Things to keep in mind: Hard Bounce is pretty easy to control. Clean your mailing list using an online list cleaning tool and you will have practically zero bounces.
But there’s more your list cleaning tool can do.
Some of your emails may not bounce, but they won’t provide engagement either. It’s important to understand how role-addresses impact your email deliverability.
Role-addresses (those addresses like support@, sales@ and so on) may be valid but since they are monitored by someone in a certain role – or even teams – there’s not much to expect in terms of engagement.
Also, role-addresses have a tendency of spam complaints. It’s a good idea to move role-addresses into a suppression list.
5. Unsubscribes and Complaints
What are Unsubscribes and Complaints: This tells you how many people on your mailing list are leaving and how many people think you’re spamming them.
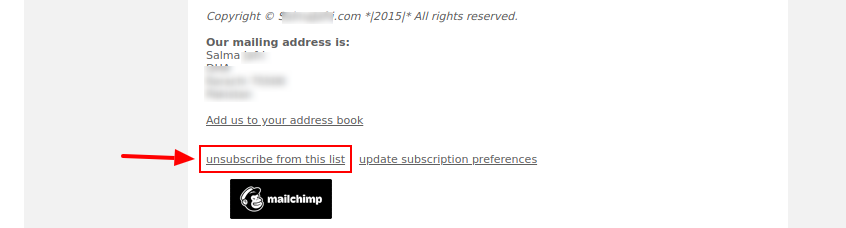
Unsubribe Rate also offers you a chance to review your content strategy, among other things.
How are Unsubscribes and Complaints measured: Unsubscribes are calculated as a percentage of the total number of your subscribers.
Complaints are calculated pretty much the same way, but your Email Service Provider (ESP) will look at it more closely.
Example: Let’s say you have a subscriber list of 1,000 and 110 people unsubscribe. That means your Unsubscribe Rate is (110 / 1000) x 100 = 11%.
Of the 1,000 emails you sent out, if 29 people complain you’re spamming them, your Complaint Rate is (29 / 1,000) x 100 = 2.9%.
How to use Unsubscribes and Complaints: If you’re receiving complaints, you’re most likely not following best practices in mind while sending out emails. Or your content or subject-line sucks.
Or maybe you’ve got the wrong audience.
When complaints cross a certain threshold, your ESP gets worried you’re spamming people using its platform. And so it will quickly demand an explanation or even ask you to stop using their service.
Things to keep in mind: Why did we club these two together?
That’s because of a number of reasons, like:
- Your subscriber recalls signing in but is no longer interested to continue. While scrolling, she couldn’t easily find the Unsubscribe link in your email so she simply marked your email as Spam.
- Your subscriber forgot she had signed up and she marks your email as Spam.
- Your subscriber accidentally clicked on Unsubscribe (or Spam). Boom! There you go.
- You didn’t double opt-in the subscriber. So Mary Clarke begins receiving your emails because Marty Clarke had, due to a typo, entered mary.clarke(at) domain .com instead of marty.clarke(at) domain .com. And Mary (rightly) thinks you’re spamming her inbox.
6. List Growth Rate
What is List Growth Rate: The List Growth Rate tells you the rate at which you’re adding subscribers to your mailing list.
How is List Growth Rate measured: Calculate your net List Growth Rate this way: divide the net new subscribers (new subscribers minus unsubscribes) by the total number of email addresses on your list currently. Multiply it by hundred to express the value in percentage.
Example: Let’s say there are 1,000 email addresses on your mailing list right now. This month, you had 240 new subscribers against 40 people who unsubscribers. Your List Growth Rate will be (240 – 40) / 1,000 * 100 = 20%.
How to use List Growth Rate: Your List Growth Rate metric can tell you if you’re putting in enough efforts into list building and whether you’re getting results.
A negative rate (where the number of unsubscribe requests exceed the number of new subscribers) is the right time to segment your list.
Things to keep in mind: An estimated 22% of your email addresses die every year anyway, thanks to multiple reasons. To stay on the top of your game, therefore, you must be able to constantly find newer and more powerful ways of countering that and adding more targeted subscribers.
Cleaning your mailing list regularly too leads to a drop in the number of your subscribers, but that’s actually good because the cleaned mailing list will have a better deliverability.
7. Sharing and Forwarding Rate (SFR)
What is Sharing and Forwarding Rate (SFR): The Sharing and Forwarding Rate (SFR) is the number of times your subscribers share your email with people they’re connected with. It includes social media shares and email forwards.
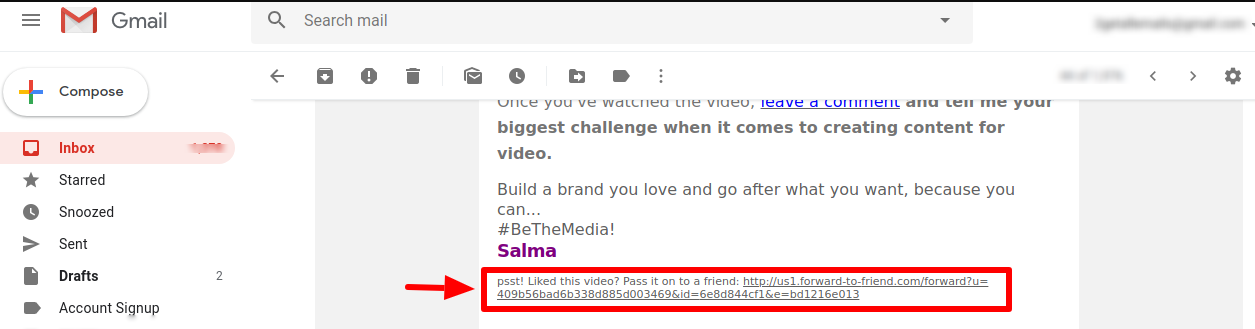
Encourage forwarding your email by providing a link.
How is Sharing and Forwarding Rate measured: The SFR is calculated as the number of clicks on Share or Forward button, divided by the number of emails delivered and then multiplied by 100.
Example: Let’s say 1,000 of your email reached the inbox of recipients. From them, 11 people hit the Forward (or Share) button. Your SFR will be (11 / 1,000) * 100 = 1.1%.
How to use Sharing and Forwarding Rate: It is likely you don’t insert social sharing buttons in each of your emails.
SFR can tell you a great deal. Because it takes some effort (however small) on part of the subscriber to forward or share your email, you can interpret this as a sign of your having delivered higher-than-average value in that email.
Analyse that email to see how you can replicate the same engagement in future emails.
Things to keep in mind: Don’t forget laws like the GDPR prevent you from adding people to your mailing list just because your subscribers forwarded your email to them. Forwards are an opportunity to get subscribers – you need to work on figuring out how these people too could sign up.
Because sharing and forwarding to may take time, these figures are often smaller than the actual intent of your subscribers.
8. Revenue Per Email
What is Revenue Per Email: The Revenue Per Email shows you the average revenue per email sent out.
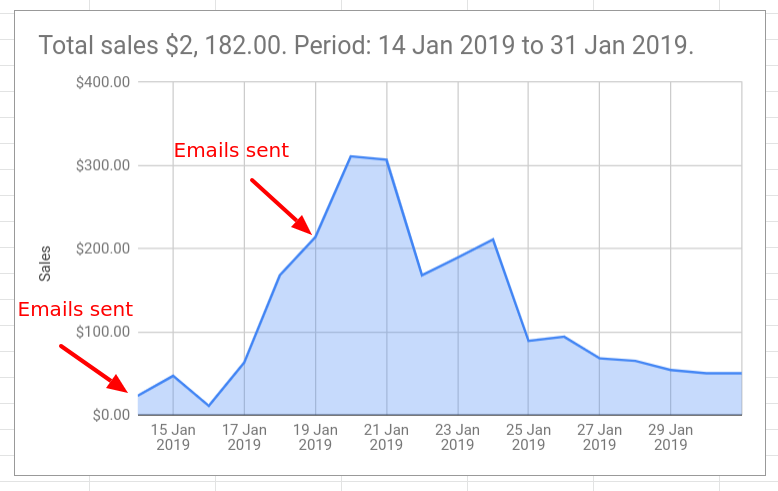
Tracking your revenue tells you how your email marketing has fared.
How is Revenue Per Email measured: Divide your total revenue generated by the total number of emails you’ve sent out.
Example: Let’s assume you earned a total revenue of $ 6,378 by sending out 500 emails. That means you earned $6,378/500 = $12.756 per email.
How to use Revenue Per Email: Revenue Per Email tells you if you’ve been able to engage your subscribers enough for them to spend money.
Things to keep in mind: Revenue isn’t the same as profit or ROI. Hence Revenue Per Email tells you if your email marketing campaign generated business, but since you haven’t factored in the costs, this metric remains incomplete.
Pay more attention to Revenue Per Email if you’ve just introduced a new product and profit isn’t your immediate concern.
This KPI can sometimes produce skewed results. Let’s say you have 3 products selling at $39, $99 and $599 each. Assume you sent out 1,000 emails and the total revenue generated is $1,797, so your Revenue Per Email is $1.797.
If you look closely, you might find see that 1 customers bought three sets of the $599 product $1,797 ($599 x 3), while the rest of your subscribers ignored you!
In this case, the Revenue Per Email effectively masks your failure to engage 99.9% of your subscribers.
Alternative: Depending upon factors like your marketing strategy and your overall goals, you can use ROI Per Email.
Because ROI takes into account your costs, it’s often considered a more down-to-earth metric.
This is how you calculate ROI Per Email:
(Total revenue less total costs) divided by (total number of emails).
Again, you’ll need to decide which all costs you’ll want to include here.
9. Device, System and Other metrics
What is Device Metrics: Device Metrics tell you how your emails are performing across various various devices (and operating systems and email clients).
How is Device Metrics measured: You can measure what percent of your emails are opened on mobile devices. Divide emails opened on mobile devices by total emails opened and then multiply by 100 to get the percentage value.
Example: Let’s say you see 1,000 emails were opened, of which 310 were opened on mobile devices. Out of these 310, you see 224 were opened on i-Phones. So your Device Open Rate for i-Phone will be (224 / 1,000) x 100 = 22.4%.
You can calculate similar values for Windows phones, Android devices and so on.
How to use these metrics: Firstly, you must test how your emails appear on different devices, before you hit Send.
Next compare the CTR of mobile devices with the overall CTR. Try to determine what is keeping the CTR or Open Rate of mobile devices low.
Things to keep in mind: In 2017, ReturnPath reported that over half the emails (53%) are now opened on mobile devices. It’s certain that this numbers will only increase.
You should make it your priority to ensure your emails render correctly across all devices.
Which is/are the most important email marketing metrics?
No, there can’t be a single answer that’s correct for each of you reading this.
For instance, if you’re a new entrant, your priority may be Open Rates. For other, established products, Conversion Rate could be more important than anything else. In some situations, your List Growth Rate could be key.
What you should measure pretty much depends on what you want to achieve. Your campaign goals decide what metrics you should use.
Don’t forget the most important rule here: Be consistent in measuring and regular in comparing. Unless you measure and compare on a regular basis, your metrics are trying to tell you a story you aren’t willing to listen.
Are there more metrics?
We’ve covered all the important ones.
However, there are some email marketing metrics that might matter to some of you more than to others. Here are two more metrics:
Lead Generation Rate
For all your email marketing, is your Sales team getting enough leads to pursue?
Your Lead Generation Rate can be calculated as total leads generated divided by the number of emails delivered.
Industrial marketing is unique so people asking for quotes can be said to have moved one step further in the sales funnel.
Engagement
What days of the week and times offer you better engagement opportunities? For instance, you might see a higher Open Rate on mobile devices on weekends.
You want to find out how this can be stitched into your marketing strategy.
Conclusion
One the one hand, you want to study all your metrics carefully and see how simple tweaks can work in your favor. On the other hand, it’s important that you follow email marketing best practices like maintaining list hygiene, following regulations (e.g. GDPR), respecting subscriber choices and so on.
Email marketing is relatively inexpensive if you only look at the money you invest. But like with everything that’s good and desirable, it takes time and efforts to get amazing results from your campaign.
And here’s the basic principle of marketing to end this post with: You can’t improve what you can’t measure.